crispr cas9 technology Search Results


95
Danaher Inc nucleotide protospacer sequence crrna
Nucleotide Protospacer Sequence Crrna, supplied by Danaher Inc, used in various techniques. Bioz Stars score: 95/100, based on 1 PubMed citations. ZERO BIAS - scores, article reviews, protocol conditions and more
https://www.bioz.com/product/crispr+cas9+technology/bio_rxiv__2023__05__05__539557-335-2-6?v=Danaher+Inc
Average 95 stars, based on 1 article reviews
nucleotide protospacer sequence crrna - by Bioz Stars, 2026-08
95/100 stars
  Buy from Supplier

95
Danaher Inc alt r crispr cas9 crrna targeting crebbp exon 26
A , Odds ratio (OR) analysis of <t>CREBBP</t> and KMT2D mutations among EZB/Cluster3 DLBCL (n=319) and FL_all (merged FL datasets, n=478) cohorts of patients. The p values were calculated by Fisher’s exact test. B , Representative H&E and B220 IHC images of formalin-fixed paraffin-embedded kidney and liver sections prepared from mice euthanized at day 116 post-BMT. The scale bars represent 380 pixels. C , Representative H&E, B220 and Ki67 IHC images of formalin-fixed paraffin-embedded spleen sections from mice euthanized at day 235 post-BMT. The scale bars represent 200 pixels. D , Representative FACS plots show the gating strategy and frequency of B220 + CD38 - FAS + splenic GC B cells in mice at day 235 post-BMT. E , FACS analysis showing the relative abundance of splenic total B cells (B220 + ) normalized to total single cells at day 116 and 235 post-BMT (mean ± SD). Each dot represents a mouse (n=4 mice per genotype).
Alt R Crispr Cas9 Crrna Targeting Crebbp Exon 26, supplied by Danaher Inc, used in various techniques. Bioz Stars score: 95/100, based on 1 PubMed citations. ZERO BIAS - scores, article reviews, protocol conditions and more
https://www.bioz.com/product/crispr+cas9+technology/bio_rxiv__2023__02__13__528351-321-11-8?v=Danaher+Inc
Average 95 stars, based on 1 article reviews
alt r crispr cas9 crrna targeting crebbp exon 26 - by Bioz Stars, 2026-08
95/100 stars
  Buy from Supplier

95
Danaher Inc guide rna
A , Odds ratio (OR) analysis of <t>CREBBP</t> and KMT2D mutations among EZB/Cluster3 DLBCL (n=319) and FL_all (merged FL datasets, n=478) cohorts of patients. The p values were calculated by Fisher’s exact test. B , Representative H&E and B220 IHC images of formalin-fixed paraffin-embedded kidney and liver sections prepared from mice euthanized at day 116 post-BMT. The scale bars represent 380 pixels. C , Representative H&E, B220 and Ki67 IHC images of formalin-fixed paraffin-embedded spleen sections from mice euthanized at day 235 post-BMT. The scale bars represent 200 pixels. D , Representative FACS plots show the gating strategy and frequency of B220 + CD38 - FAS + splenic GC B cells in mice at day 235 post-BMT. E , FACS analysis showing the relative abundance of splenic total B cells (B220 + ) normalized to total single cells at day 116 and 235 post-BMT (mean ± SD). Each dot represents a mouse (n=4 mice per genotype).
Guide Rna, supplied by Danaher Inc, used in various techniques. Bioz Stars score: 95/100, based on 1 PubMed citations. ZERO BIAS - scores, article reviews, protocol conditions and more
https://www.bioz.com/product/crispr+cas9+technology/bio_rxiv__2020__04__13__039297-144-10-12?v=Danaher+Inc
Average 95 stars, based on 1 article reviews
guide rna - by Bioz Stars, 2026-08
95/100 stars
  Buy from Supplier

95
Danaher Inc alt r crispr cas9 human control kit
A , Odds ratio (OR) analysis of <t>CREBBP</t> and KMT2D mutations among EZB/Cluster3 DLBCL (n=319) and FL_all (merged FL datasets, n=478) cohorts of patients. The p values were calculated by Fisher’s exact test. B , Representative H&E and B220 IHC images of formalin-fixed paraffin-embedded kidney and liver sections prepared from mice euthanized at day 116 post-BMT. The scale bars represent 380 pixels. C , Representative H&E, B220 and Ki67 IHC images of formalin-fixed paraffin-embedded spleen sections from mice euthanized at day 235 post-BMT. The scale bars represent 200 pixels. D , Representative FACS plots show the gating strategy and frequency of B220 + CD38 - FAS + splenic GC B cells in mice at day 235 post-BMT. E , FACS analysis showing the relative abundance of splenic total B cells (B220 + ) normalized to total single cells at day 116 and 235 post-BMT (mean ± SD). Each dot represents a mouse (n=4 mice per genotype).
Alt R Crispr Cas9 Human Control Kit, supplied by Danaher Inc, used in various techniques. Bioz Stars score: 95/100, based on 1 PubMed citations. ZERO BIAS - scores, article reviews, protocol conditions and more
https://www.bioz.com/product/crispr+cas9+technology/bio_rxiv__2023__02__08__527795-45-8-13?v=Danaher+Inc
Average 95 stars, based on 1 article reviews
alt r crispr cas9 human control kit - by Bioz Stars, 2026-08
95/100 stars
  Buy from Supplier

95
Danaher Inc mouse alt r crispr cas9 control kit
A , Odds ratio (OR) analysis of <t>CREBBP</t> and KMT2D mutations among EZB/Cluster3 DLBCL (n=319) and FL_all (merged FL datasets, n=478) cohorts of patients. The p values were calculated by Fisher’s exact test. B , Representative H&E and B220 IHC images of formalin-fixed paraffin-embedded kidney and liver sections prepared from mice euthanized at day 116 post-BMT. The scale bars represent 380 pixels. C , Representative H&E, B220 and Ki67 IHC images of formalin-fixed paraffin-embedded spleen sections from mice euthanized at day 235 post-BMT. The scale bars represent 200 pixels. D , Representative FACS plots show the gating strategy and frequency of B220 + CD38 - FAS + splenic GC B cells in mice at day 235 post-BMT. E , FACS analysis showing the relative abundance of splenic total B cells (B220 + ) normalized to total single cells at day 116 and 235 post-BMT (mean ± SD). Each dot represents a mouse (n=4 mice per genotype).
Mouse Alt R Crispr Cas9 Control Kit, supplied by Danaher Inc, used in various techniques. Bioz Stars score: 95/100, based on 1 PubMed citations. ZERO BIAS - scores, article reviews, protocol conditions and more
https://www.bioz.com/product/crispr+cas9+technology/bio_rxiv__2023__04__09__535589-45-26-31?v=Danaher+Inc
Average 95 stars, based on 1 article reviews
mouse alt r crispr cas9 control kit - by Bioz Stars, 2026-08
95/100 stars
  Buy from Supplier

95
Danaher Inc alt r crispr cas 9 system
A , Odds ratio (OR) analysis of <t>CREBBP</t> and KMT2D mutations among EZB/Cluster3 DLBCL (n=319) and FL_all (merged FL datasets, n=478) cohorts of patients. The p values were calculated by Fisher’s exact test. B , Representative H&E and B220 IHC images of formalin-fixed paraffin-embedded kidney and liver sections prepared from mice euthanized at day 116 post-BMT. The scale bars represent 380 pixels. C , Representative H&E, B220 and Ki67 IHC images of formalin-fixed paraffin-embedded spleen sections from mice euthanized at day 235 post-BMT. The scale bars represent 200 pixels. D , Representative FACS plots show the gating strategy and frequency of B220 + CD38 - FAS + splenic GC B cells in mice at day 235 post-BMT. E , FACS analysis showing the relative abundance of splenic total B cells (B220 + ) normalized to total single cells at day 116 and 235 post-BMT (mean ± SD). Each dot represents a mouse (n=4 mice per genotype).
Alt R Crispr Cas 9 System, supplied by Danaher Inc, used in various techniques. Bioz Stars score: 95/100, based on 1 PubMed citations. ZERO BIAS - scores, article reviews, protocol conditions and more
https://www.bioz.com/product/crispr+cas9+technology/pmc07498019-49-1-5?v=Danaher+Inc
Average 95 stars, based on 1 article reviews
alt r crispr cas 9 system - by Bioz Stars, 2026-08
95/100 stars
  Buy from Supplier

90
OpenCell Technologies Inc crispr/cas9
A , Odds ratio (OR) analysis of <t>CREBBP</t> and KMT2D mutations among EZB/Cluster3 DLBCL (n=319) and FL_all (merged FL datasets, n=478) cohorts of patients. The p values were calculated by Fisher’s exact test. B , Representative H&E and B220 IHC images of formalin-fixed paraffin-embedded kidney and liver sections prepared from mice euthanized at day 116 post-BMT. The scale bars represent 380 pixels. C , Representative H&E, B220 and Ki67 IHC images of formalin-fixed paraffin-embedded spleen sections from mice euthanized at day 235 post-BMT. The scale bars represent 200 pixels. D , Representative FACS plots show the gating strategy and frequency of B220 + CD38 - FAS + splenic GC B cells in mice at day 235 post-BMT. E , FACS analysis showing the relative abundance of splenic total B cells (B220 + ) normalized to total single cells at day 116 and 235 post-BMT (mean ± SD). Each dot represents a mouse (n=4 mice per genotype).
Crispr/Cas9, supplied by OpenCell Technologies Inc, used in various techniques. Bioz Stars score: 90/100, based on 1 PubMed citations. ZERO BIAS - scores, article reviews, protocol conditions and more
https://www.bioz.com/product/crispr+cas9+technology/bio_rxiv__2024__09__11__612480-132-6-44?v=OpenCell+Technologies+Inc
Average 90 stars, based on 1 article reviews
crispr/cas9 - by Bioz Stars, 2026-08
90/100 stars
  Buy from Supplier

90
Qianxin High Technology Co Ltd crispr-cas9 genome engineering
A , Odds ratio (OR) analysis of <t>CREBBP</t> and KMT2D mutations among EZB/Cluster3 DLBCL (n=319) and FL_all (merged FL datasets, n=478) cohorts of patients. The p values were calculated by Fisher’s exact test. B , Representative H&E and B220 IHC images of formalin-fixed paraffin-embedded kidney and liver sections prepared from mice euthanized at day 116 post-BMT. The scale bars represent 380 pixels. C , Representative H&E, B220 and Ki67 IHC images of formalin-fixed paraffin-embedded spleen sections from mice euthanized at day 235 post-BMT. The scale bars represent 200 pixels. D , Representative FACS plots show the gating strategy and frequency of B220 + CD38 - FAS + splenic GC B cells in mice at day 235 post-BMT. E , FACS analysis showing the relative abundance of splenic total B cells (B220 + ) normalized to total single cells at day 116 and 235 post-BMT (mean ± SD). Each dot represents a mouse (n=4 mice per genotype).
Crispr Cas9 Genome Engineering, supplied by Qianxin High Technology Co Ltd, used in various techniques. Bioz Stars score: 90/100, based on 1 PubMed citations. ZERO BIAS - scores, article reviews, protocol conditions and more
https://www.bioz.com/product/crispr+cas9+technology/pm29235467-0-9-13?v=Qianxin+High+Technology+Co+Ltd
Average 90 stars, based on 1 article reviews
crispr-cas9 genome engineering - by Bioz Stars, 2026-08
90/100 stars
  Buy from Supplier

90
Monsanto Technology LLC crispr/cas9
A , Odds ratio (OR) analysis of <t>CREBBP</t> and KMT2D mutations among EZB/Cluster3 DLBCL (n=319) and FL_all (merged FL datasets, n=478) cohorts of patients. The p values were calculated by Fisher’s exact test. B , Representative H&E and B220 IHC images of formalin-fixed paraffin-embedded kidney and liver sections prepared from mice euthanized at day 116 post-BMT. The scale bars represent 380 pixels. C , Representative H&E, B220 and Ki67 IHC images of formalin-fixed paraffin-embedded spleen sections from mice euthanized at day 235 post-BMT. The scale bars represent 200 pixels. D , Representative FACS plots show the gating strategy and frequency of B220 + CD38 - FAS + splenic GC B cells in mice at day 235 post-BMT. E , FACS analysis showing the relative abundance of splenic total B cells (B220 + ) normalized to total single cells at day 116 and 235 post-BMT (mean ± SD). Each dot represents a mouse (n=4 mice per genotype).
Crispr/Cas9, supplied by Monsanto Technology LLC, used in various techniques. Bioz Stars score: 90/100, based on 1 PubMed citations. ZERO BIAS - scores, article reviews, protocol conditions and more
https://www.bioz.com/product/crispr+cas9+technology/10__1271_slash_kagakutoseibutsu__55__676-21-30-45?v=Monsanto+Technology+LLC
Average 90 stars, based on 1 article reviews
crispr/cas9 - by Bioz Stars, 2026-08
90/100 stars
  Buy from Supplier

90
BioProcess Technology Consultants crispr/cas9 tools
A , Odds ratio (OR) analysis of <t>CREBBP</t> and KMT2D mutations among EZB/Cluster3 DLBCL (n=319) and FL_all (merged FL datasets, n=478) cohorts of patients. The p values were calculated by Fisher’s exact test. B , Representative H&E and B220 IHC images of formalin-fixed paraffin-embedded kidney and liver sections prepared from mice euthanized at day 116 post-BMT. The scale bars represent 380 pixels. C , Representative H&E, B220 and Ki67 IHC images of formalin-fixed paraffin-embedded spleen sections from mice euthanized at day 235 post-BMT. The scale bars represent 200 pixels. D , Representative FACS plots show the gating strategy and frequency of B220 + CD38 - FAS + splenic GC B cells in mice at day 235 post-BMT. E , FACS analysis showing the relative abundance of splenic total B cells (B220 + ) normalized to total single cells at day 116 and 235 post-BMT (mean ± SD). Each dot represents a mouse (n=4 mice per genotype).
Crispr/Cas9 Tools, supplied by BioProcess Technology Consultants, used in various techniques. Bioz Stars score: 90/100, based on 1 PubMed citations. ZERO BIAS - scores, article reviews, protocol conditions and more
https://www.bioz.com/product/crispr+cas9+technology/pmc12016505__aem__02183___24___s0001-2-10-48?v=BioProcess+Technology+Consultants
Average 90 stars, based on 1 article reviews
crispr/cas9 tools - by Bioz Stars, 2026-08
90/100 stars
  Buy from Supplier

90
PETTINGILL TECHNOLOGY LTD crispr-cas9
A , Odds ratio (OR) analysis of <t>CREBBP</t> and KMT2D mutations among EZB/Cluster3 DLBCL (n=319) and FL_all (merged FL datasets, n=478) cohorts of patients. The p values were calculated by Fisher’s exact test. B , Representative H&E and B220 IHC images of formalin-fixed paraffin-embedded kidney and liver sections prepared from mice euthanized at day 116 post-BMT. The scale bars represent 380 pixels. C , Representative H&E, B220 and Ki67 IHC images of formalin-fixed paraffin-embedded spleen sections from mice euthanized at day 235 post-BMT. The scale bars represent 200 pixels. D , Representative FACS plots show the gating strategy and frequency of B220 + CD38 - FAS + splenic GC B cells in mice at day 235 post-BMT. E , FACS analysis showing the relative abundance of splenic total B cells (B220 + ) normalized to total single cells at day 116 and 235 post-BMT (mean ± SD). Each dot represents a mouse (n=4 mice per genotype).
Crispr Cas9, supplied by PETTINGILL TECHNOLOGY LTD, used in various techniques. Bioz Stars score: 90/100, based on 1 PubMed citations. ZERO BIAS - scores, article reviews, protocol conditions and more
https://www.bioz.com/product/crispr+cas9+technology/pmc08075356-34-17-8?v=PETTINGILL+TECHNOLOGY+LTD
Average 90 stars, based on 1 article reviews
crispr-cas9 - by Bioz Stars, 2026-08
90/100 stars
  Buy from Supplier

86
Shanghai Model Organisms Center crispr cas9 genome editing technology
A , Odds ratio (OR) analysis of <t>CREBBP</t> and KMT2D mutations among EZB/Cluster3 DLBCL (n=319) and FL_all (merged FL datasets, n=478) cohorts of patients. The p values were calculated by Fisher’s exact test. B , Representative H&E and B220 IHC images of formalin-fixed paraffin-embedded kidney and liver sections prepared from mice euthanized at day 116 post-BMT. The scale bars represent 380 pixels. C , Representative H&E, B220 and Ki67 IHC images of formalin-fixed paraffin-embedded spleen sections from mice euthanized at day 235 post-BMT. The scale bars represent 200 pixels. D , Representative FACS plots show the gating strategy and frequency of B220 + CD38 - FAS + splenic GC B cells in mice at day 235 post-BMT. E , FACS analysis showing the relative abundance of splenic total B cells (B220 + ) normalized to total single cells at day 116 and 235 post-BMT (mean ± SD). Each dot represents a mouse (n=4 mice per genotype).
Crispr Cas9 Genome Editing Technology, supplied by Shanghai Model Organisms Center, used in various techniques. Bioz Stars score: 86/100, based on 1 PubMed citations. ZERO BIAS - scores, article reviews, protocol conditions and more
https://www.bioz.com/product/crispr+cas9+technology/pm41270735-286-8-12?v=Shanghai+Model+Organisms+Center
Average 86 stars, based on 1 article reviews
crispr cas9 genome editing technology - by Bioz Stars, 2026-08
86/100 stars
  Buy from Supplier

Image Search Results


A , Odds ratio (OR) analysis of CREBBP and KMT2D mutations among EZB/Cluster3 DLBCL (n=319) and FL_all (merged FL datasets, n=478) cohorts of patients. The p values were calculated by Fisher’s exact test. B , Representative H&E and B220 IHC images of formalin-fixed paraffin-embedded kidney and liver sections prepared from mice euthanized at day 116 post-BMT. The scale bars represent 380 pixels. C , Representative H&E, B220 and Ki67 IHC images of formalin-fixed paraffin-embedded spleen sections from mice euthanized at day 235 post-BMT. The scale bars represent 200 pixels. D , Representative FACS plots show the gating strategy and frequency of B220 + CD38 - FAS + splenic GC B cells in mice at day 235 post-BMT. E , FACS analysis showing the relative abundance of splenic total B cells (B220 + ) normalized to total single cells at day 116 and 235 post-BMT (mean ± SD). Each dot represents a mouse (n=4 mice per genotype).

Journal: bioRxiv

Article Title: Cooperative super-enhancer inactivation caused by heterozygous loss of CREBBP and KMT2D skews B cell fate decisions and yields T cell-depleted lymphomas

doi: 10.1101/2023.02.13.528351

Figure Lengend Snippet: A , Odds ratio (OR) analysis of CREBBP and KMT2D mutations among EZB/Cluster3 DLBCL (n=319) and FL_all (merged FL datasets, n=478) cohorts of patients. The p values were calculated by Fisher’s exact test. B , Representative H&E and B220 IHC images of formalin-fixed paraffin-embedded kidney and liver sections prepared from mice euthanized at day 116 post-BMT. The scale bars represent 380 pixels. C , Representative H&E, B220 and Ki67 IHC images of formalin-fixed paraffin-embedded spleen sections from mice euthanized at day 235 post-BMT. The scale bars represent 200 pixels. D , Representative FACS plots show the gating strategy and frequency of B220 + CD38 - FAS + splenic GC B cells in mice at day 235 post-BMT. E , FACS analysis showing the relative abundance of splenic total B cells (B220 + ) normalized to total single cells at day 116 and 235 post-BMT (mean ± SD). Each dot represents a mouse (n=4 mice per genotype).

Article Snippet: HiFi Cas9 Nuclease (IDT; 1081061), Alt-R CRISPR-Cas9 tracrRNA (IDT; 1072534), and Alt-R CRISPR-Cas9 crRNA targeting CREBBP exon 26 or KMT2D exon 4, were assembled in vitro following the manufacturer’s protocol and delivered into OCI-Ly7 cells by electroporation using SF Cell Line 96-well Nucleofector Kit (Lonza; V4SC-2096). ssODN for CREBBP R1446C mutagenesis was added along with RNP complex during electroporation as needed.

Techniques: Formalin-fixed Paraffin-Embedded
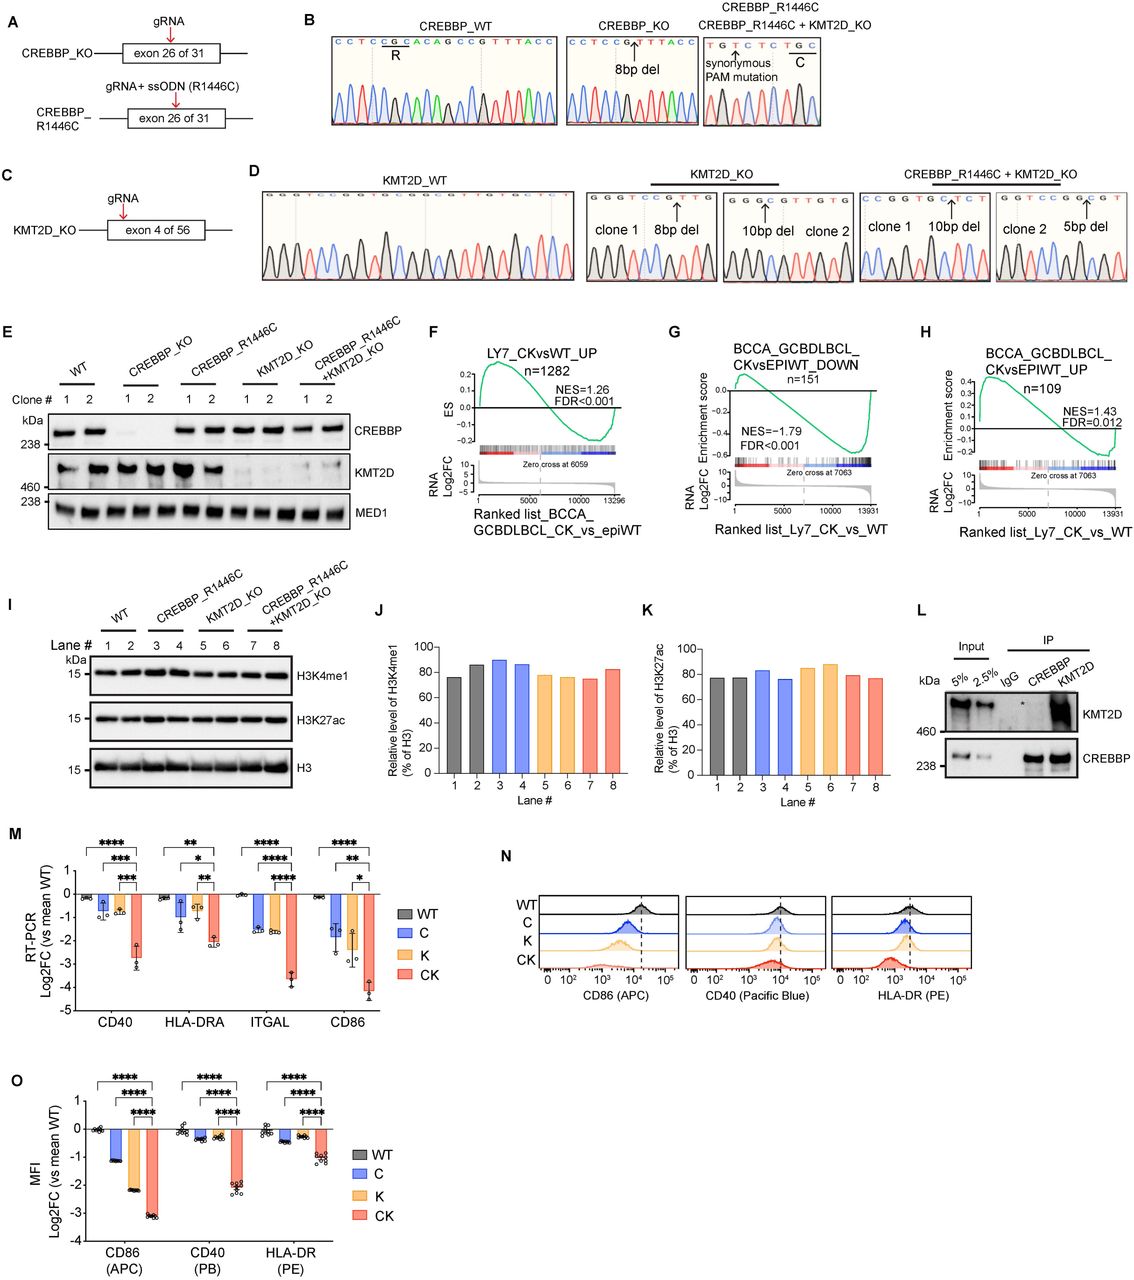
A , Experimental design for generating CREBBP -KO and CREBBP -R1446C, an enzymatically dead mutant, OCI-Ly7 cell lines. ssODN: single-stranded oligodeoxynucleotide. B , Sanger sequencing chromatogram confirming the homozygous knock out or R1446C point mutation in CREBBP . C , Experimental design for generating KMT2D -KO OCI-Ly7 cell line. D , Sanger sequencing chromatogram confirming the homozygous knock out of KMT2D . E , Immunoblotting for endogenous CREBBP and KMT2D in the indicated isogenic OCI-Ly7 cell lines using MED1 as internal loading control. F , GSEA plot using CK vs WT upregulated genes in OCI-Ly7 as the gene set against a ranked gene list based on CK vs epigenetic WT RNA-seq datasets of human BCCA cohort GCB-DLBCL patients. NES, normalized enrichment score. The p value was calculated by an empirical phenotype-based permutation test. The FDR is adjusted for gene set size and multiple hypotheses testing. G-H , GSEA plots using CK vs epigenetic WT ( G ) downregulated or ( H ) upregulated genes in human BCCA cohort GCB-DLBCL patients as the gene set against a ranked gene list based on CK vs WT OCI-Ly7 RNA-seq datasets. NES, normalized enrichment score. The p value was calculated by an empirical phenotype-based permutation test. The FDR is adjusted for gene set size and multiple hypotheses testing. I , Immunoblot for H3K4me1, H3K27ac and H3 in isogenic OCI-Ly7 cells. J-K , Relative densitometry of ( J ) H3K4me1 and ( K ) H3K27ac for panel I . L , Co-IP for assessing interaction between endogenous CREBBP and KMT2D in human SUDHL4 GCB-DLBCL cell line. M , RT-qPCR of indicated genes in different isogenic OCI-Ly7 cells. qPCR signal for each gene was normalized to those of HPRT and then mean WT and presented as log2 fold-change ± SEM. Statistical significance was determined using ordinary one-way ANOVA followed by Tukey-Kramer’s multiple comparisons test (**p < 0.01, ***p < 0.001, ****p < 0.0001). N , Stacked flow cytometry histograms showing the progressive signal decrease for the indicated surface markers in C, K, and CK-deficient OCI-Ly7 cells compared to WT. O , FACS measuring cell surface levels of the indicated markers in different isogenic OCI-Ly7 cells. Mean fluorescence intensity (MFI) of each surface marker was normalized to mean WT and presented as log2 fold-change ± SEM. Each dot represents a biological replicate. Statistical significance was determined using ordinary one-way ANOVA followed by Tukey-Kramer’s multiple comparisons test (****p < 0.0001).

Journal: bioRxiv

Article Title: Cooperative super-enhancer inactivation caused by heterozygous loss of CREBBP and KMT2D skews B cell fate decisions and yields T cell-depleted lymphomas

doi: 10.1101/2023.02.13.528351

Figure Lengend Snippet: A , Experimental design for generating CREBBP -KO and CREBBP -R1446C, an enzymatically dead mutant, OCI-Ly7 cell lines. ssODN: single-stranded oligodeoxynucleotide. B , Sanger sequencing chromatogram confirming the homozygous knock out or R1446C point mutation in CREBBP . C , Experimental design for generating KMT2D -KO OCI-Ly7 cell line. D , Sanger sequencing chromatogram confirming the homozygous knock out of KMT2D . E , Immunoblotting for endogenous CREBBP and KMT2D in the indicated isogenic OCI-Ly7 cell lines using MED1 as internal loading control. F , GSEA plot using CK vs WT upregulated genes in OCI-Ly7 as the gene set against a ranked gene list based on CK vs epigenetic WT RNA-seq datasets of human BCCA cohort GCB-DLBCL patients. NES, normalized enrichment score. The p value was calculated by an empirical phenotype-based permutation test. The FDR is adjusted for gene set size and multiple hypotheses testing. G-H , GSEA plots using CK vs epigenetic WT ( G ) downregulated or ( H ) upregulated genes in human BCCA cohort GCB-DLBCL patients as the gene set against a ranked gene list based on CK vs WT OCI-Ly7 RNA-seq datasets. NES, normalized enrichment score. The p value was calculated by an empirical phenotype-based permutation test. The FDR is adjusted for gene set size and multiple hypotheses testing. I , Immunoblot for H3K4me1, H3K27ac and H3 in isogenic OCI-Ly7 cells. J-K , Relative densitometry of ( J ) H3K4me1 and ( K ) H3K27ac for panel I . L , Co-IP for assessing interaction between endogenous CREBBP and KMT2D in human SUDHL4 GCB-DLBCL cell line. M , RT-qPCR of indicated genes in different isogenic OCI-Ly7 cells. qPCR signal for each gene was normalized to those of HPRT and then mean WT and presented as log2 fold-change ± SEM. Statistical significance was determined using ordinary one-way ANOVA followed by Tukey-Kramer’s multiple comparisons test (**p < 0.01, ***p < 0.001, ****p < 0.0001). N , Stacked flow cytometry histograms showing the progressive signal decrease for the indicated surface markers in C, K, and CK-deficient OCI-Ly7 cells compared to WT. O , FACS measuring cell surface levels of the indicated markers in different isogenic OCI-Ly7 cells. Mean fluorescence intensity (MFI) of each surface marker was normalized to mean WT and presented as log2 fold-change ± SEM. Each dot represents a biological replicate. Statistical significance was determined using ordinary one-way ANOVA followed by Tukey-Kramer’s multiple comparisons test (****p < 0.0001).

Article Snippet: HiFi Cas9 Nuclease (IDT; 1081061), Alt-R CRISPR-Cas9 tracrRNA (IDT; 1072534), and Alt-R CRISPR-Cas9 crRNA targeting CREBBP exon 26 or KMT2D exon 4, were assembled in vitro following the manufacturer’s protocol and delivered into OCI-Ly7 cells by electroporation using SF Cell Line 96-well Nucleofector Kit (Lonza; V4SC-2096). ssODN for CREBBP R1446C mutagenesis was added along with RNP complex during electroporation as needed.

Techniques: Mutagenesis, Sequencing, Knock-Out, Western Blot, Control, RNA Sequencing, Co-Immunoprecipitation Assay, Quantitative RT-PCR, Flow Cytometry, Fluorescence, Marker
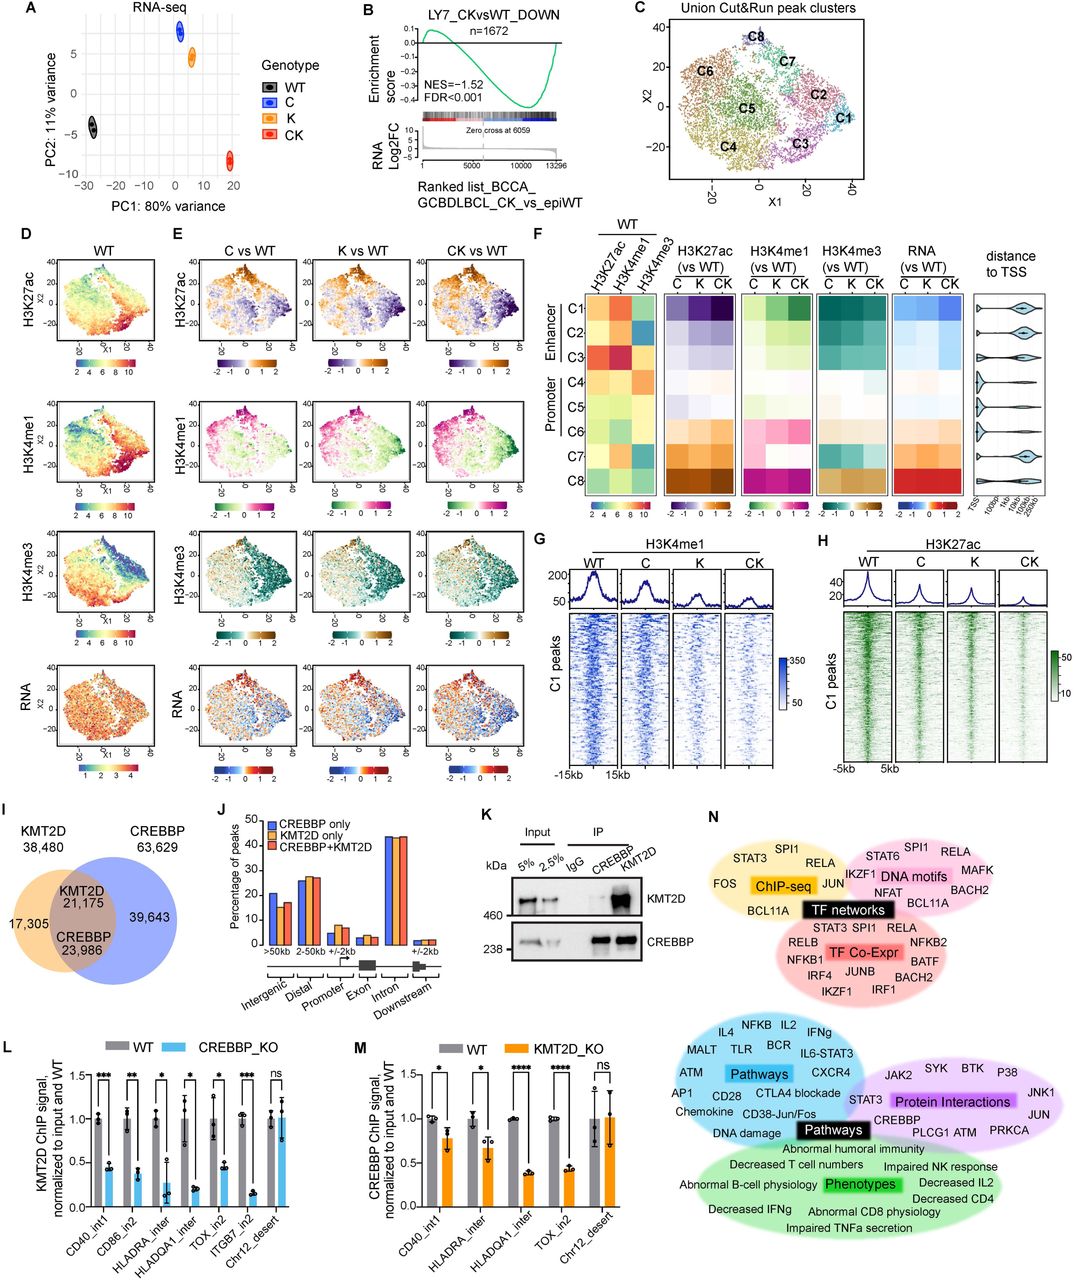
A , PCA analysis of RNA-seq datasets done in isogenic human OCI-Ly7 GCB-DLBCL cell lines (n=2 per genotype) using all genes normalized by VST. B , GSEA plot using CK vs WT downregulated genes in OCI-Ly7 as gene set against ranked gene list based on CK vs epigenetic WT (epiWT, no mutations in CREBBP , KMT2D , and EZH2 ) RNA-seq datasets of human BCCA cohort GCB-DLBCL patients. NES, normalized enrichment score. The p value was calculated by an empirical phenotype-based permutation test. The FDR is adjusted for gene set size and multiple hypotheses testing. C , t-SNE dimensionality reduction and K-means clustering of union peaks, generated by taking the union of H3K4me3, H3K4me1, and K3K27ac CUT&RUN signals from all isogenic OCI-Ly7 cell lines (WT, C, K, and CK), produced eight distinct clusters (named as C1-C8). D , t-SNE plots showing the basal level and distribution pattern of the indicated histone marks or RNA in WT OCI-Ly7 cells. The projected values are VST normalized counts. E , Read density changes for the indicated histone marks and RNA were projected onto t-SNE plots. The projected values are log2FC signal between the indicated genotypes. F , Heatmaps showing median VST normalized read density (left) or read density change (median log2FC) in C/K/CK relative to WT (middle and right) of the indicated histone marks or RNA-seq for each cluster defined in panel C . Distance to TSS plot shows the distance of union peaks to their closest TSSs. G-H , Average signal profiles (top) and heatmaps (bottom) displaying ( G ) H3K4me1 and ( H ) H3K27ac CUT&RUN signals around peak summit (+/-15kb) or peak center (+/-5kb), respectively at C1 peak regions. I , Venn diagram displaying overlap between CREBBP and KMT2D ChIP-seq peaks in OCI-Ly7. J , Genomic feature annotation of CREBBP-unique, KMT2D-unique, and CREBBP/KMT2D-co-bound ChIP-seq peaks. The definitions for different genomic features are depicted below the bar plot. K , Co-IP for assessing interaction between endogenous CREBBP and KMT2D in OCI-Ly7. CREBBP, KMT2D and IgG control were immunoprecipitated from OCI-Ly7 nuclear extracts. Western blots were performed using anti-CREBBP and KMT2D antibodies. L-M , ChIP-qPCR quantifying binding of endogenous ( L ) KMT2D and ( M ) CREBBP at the indicated gene loci in the indicated isogenic OCI-Ly7 cell lines. ChIP signals from three independent experiments were normalized to input and then to WT and presented as mean ± SD. The p values were calculated by unpaired t test and BH adjusted for multiple comparisons and denoted as follows: ns p > 0.05; *p < 0.05; **p < 0.01; ***p < 0.001; ****p < 0.0001. N , Functional annotation of C1 genes (n=401) by Enrichr and Toppgene ( , ).

Journal: bioRxiv

Article Title: Cooperative super-enhancer inactivation caused by heterozygous loss of CREBBP and KMT2D skews B cell fate decisions and yields T cell-depleted lymphomas

doi: 10.1101/2023.02.13.528351

Figure Lengend Snippet: A , PCA analysis of RNA-seq datasets done in isogenic human OCI-Ly7 GCB-DLBCL cell lines (n=2 per genotype) using all genes normalized by VST. B , GSEA plot using CK vs WT downregulated genes in OCI-Ly7 as gene set against ranked gene list based on CK vs epigenetic WT (epiWT, no mutations in CREBBP , KMT2D , and EZH2 ) RNA-seq datasets of human BCCA cohort GCB-DLBCL patients. NES, normalized enrichment score. The p value was calculated by an empirical phenotype-based permutation test. The FDR is adjusted for gene set size and multiple hypotheses testing. C , t-SNE dimensionality reduction and K-means clustering of union peaks, generated by taking the union of H3K4me3, H3K4me1, and K3K27ac CUT&RUN signals from all isogenic OCI-Ly7 cell lines (WT, C, K, and CK), produced eight distinct clusters (named as C1-C8). D , t-SNE plots showing the basal level and distribution pattern of the indicated histone marks or RNA in WT OCI-Ly7 cells. The projected values are VST normalized counts. E , Read density changes for the indicated histone marks and RNA were projected onto t-SNE plots. The projected values are log2FC signal between the indicated genotypes. F , Heatmaps showing median VST normalized read density (left) or read density change (median log2FC) in C/K/CK relative to WT (middle and right) of the indicated histone marks or RNA-seq for each cluster defined in panel C . Distance to TSS plot shows the distance of union peaks to their closest TSSs. G-H , Average signal profiles (top) and heatmaps (bottom) displaying ( G ) H3K4me1 and ( H ) H3K27ac CUT&RUN signals around peak summit (+/-15kb) or peak center (+/-5kb), respectively at C1 peak regions. I , Venn diagram displaying overlap between CREBBP and KMT2D ChIP-seq peaks in OCI-Ly7. J , Genomic feature annotation of CREBBP-unique, KMT2D-unique, and CREBBP/KMT2D-co-bound ChIP-seq peaks. The definitions for different genomic features are depicted below the bar plot. K , Co-IP for assessing interaction between endogenous CREBBP and KMT2D in OCI-Ly7. CREBBP, KMT2D and IgG control were immunoprecipitated from OCI-Ly7 nuclear extracts. Western blots were performed using anti-CREBBP and KMT2D antibodies. L-M , ChIP-qPCR quantifying binding of endogenous ( L ) KMT2D and ( M ) CREBBP at the indicated gene loci in the indicated isogenic OCI-Ly7 cell lines. ChIP signals from three independent experiments were normalized to input and then to WT and presented as mean ± SD. The p values were calculated by unpaired t test and BH adjusted for multiple comparisons and denoted as follows: ns p > 0.05; *p < 0.05; **p < 0.01; ***p < 0.001; ****p < 0.0001. N , Functional annotation of C1 genes (n=401) by Enrichr and Toppgene ( , ).

Article Snippet: HiFi Cas9 Nuclease (IDT; 1081061), Alt-R CRISPR-Cas9 tracrRNA (IDT; 1072534), and Alt-R CRISPR-Cas9 crRNA targeting CREBBP exon 26 or KMT2D exon 4, were assembled in vitro following the manufacturer’s protocol and delivered into OCI-Ly7 cells by electroporation using SF Cell Line 96-well Nucleofector Kit (Lonza; V4SC-2096). ssODN for CREBBP R1446C mutagenesis was added along with RNP complex during electroporation as needed.

Techniques: RNA Sequencing, Generated, Produced, ChIP-sequencing, Co-Immunoprecipitation Assay, Control, Immunoprecipitation, Western Blot, ChIP-qPCR, Binding Assay, Functional Assay